The first DDDBE Modellathon
On our way back from DDD Exchange, heavily influenced by yet another immersive DDD experience, we searched for ways to keep the momentum going. Sure, we met up regularly for CQRS beers, but we felt that we could do more, better. That’s when we coined the term modellathon, something like a hackathon, but instead of writing code, we would build models.
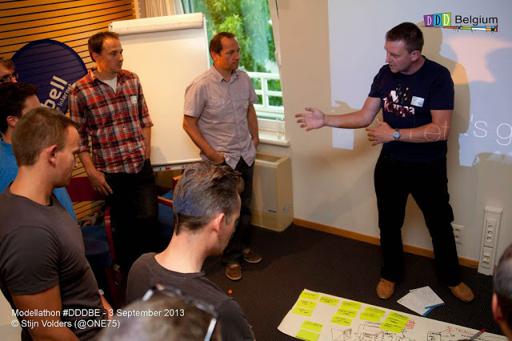
Thanks to the effort of Mathias, Stijn and Yves, Tuesday marked the first get-together of the Belgian DDD user group in its official form. Combell was kind enough to provide us with a location, while Mathias fronted paper - lots of it too, post-its and markers.
Mathias and Stijn took the lead introducing themselves as domain experts of the day. The domain? The United Schools of Kazachstan.
We split up into groups of four, and used our first pomodoro trying to understand the domain. The second pomodoro, we threw everything away and started fresh.
The first modeling technique our group tried was Alberto Brandolini‘s event storming. We took what we thought was the most important event report approved, wrote it on a post-it, and posted it on the center of our sheet of paper. Then we worked our way back to how we got there, but also looked at what happened next. This modeling approach yielded results very quickly; we all gained a decent understanding of everything what’s going on in the domain. Talking to the domain expert made it obvious what the hotspots were, he kept referring to two post-its in particular.
We might have zoomed in right there, but for the sake of experimenting with event storming, we stuck to events a little longer. We added commands, looked for clusters, made aggregate boundaries based on that, and looked where they were talking to each other.
We initially used a sheet of paper and stayed seated, but this was holding us back. Once we stood up and moved to the wall, our synergy increased. Space and blood circulation seem to be important.
Flow is important too. Since we only had two domain experts, we often had to make assumptions and come up with a name that made sense. This slowed us down. We should just write down whatever we come up with, and make doubts explicit on the post-it. You can always verify and fix the language consulting the domain experts later.
The next visualization technique, initiated by Yves, took a UI-first approach. While this quickly gives you something concrete to chat about with the domain expert, I learned it can also lead you to bounded context boundaries by helping you answer the question “Where is all this data coming from, which contexts does this data belong to?”
I thought this first experiment went really well - a lot better than I expected. It proves once again the value of visualization and collaboration. All models were probably wrong, but turned out to be useful. The end result probably doesn’t matter that much, discovery and learning along the way does.
Note to self: make pictures of the end results; they would help explaining some of the experiments.
